Receipts
How to track grocery prices from your receipts
Compare item prices over time, separate price changes from buying more, and understand the purchases behind your grocery total.
By Reign ·
Your supermarket total may include more than food. Cleaning products, toiletries, and household supplies can all be part of the same purchase.
Recording the receipt lets you look at the items behind that total. In Reign, you can use those details to review categories, stores, and changes in spending.
Check what the basket contains
Snap your grocery receipt and check its purchase category, items, and suggested item tags. Correct anything that has been misread or tagged incorrectly.
When you look back at your spending, the item groups help distinguish food from other purchases made at the same store. The purchase category still describes the whole shopping trip.
Compare stores and shopping trips
Open a store from Insights to see your spending there, then open the transactions behind it. Ask: how often did you shop there, what did each trip cost, and which purchases made the difference?
Compare full months with full months.
Look at price changes where there is enough history
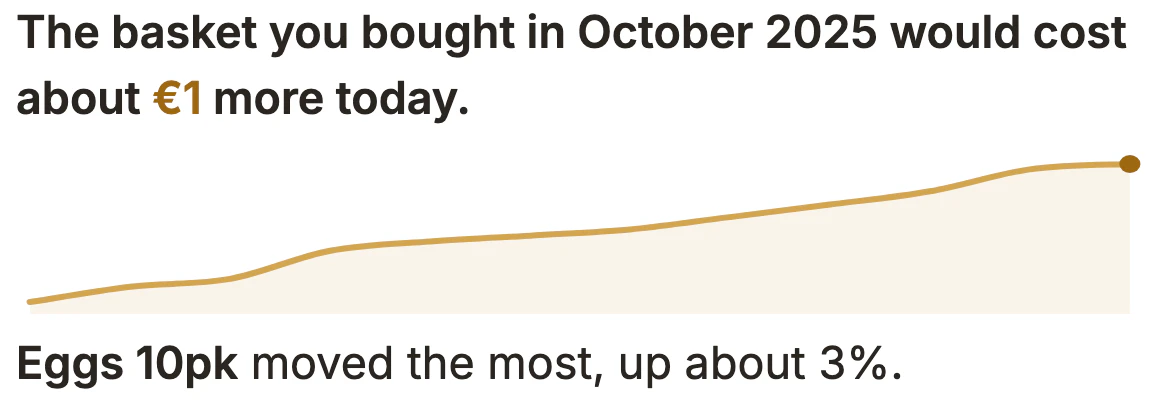
Receipt details can support comparisons of products and prices across purchases. Those comparisons need enough matching receipt data; a total from an imported statement cannot provide the missing item prices.
Some detailed comparisons require Plus. Free Insights covers this month and the previous month. Plus lets you browse every month you have recorded.
Work through one price change
Here is an illustrative calculation for the same brand and size of eggs, bought at the same store. These made-up amounts are separate from the demo screenshot above.
| Purchase | Packs | Price per pack | Total |
|---|---|---|---|
| September | 1 | €3.00 | €3.00 |
| October | 2 | €3.30 | €6.60 |
The price per pack rose €0.30, or 10%: (€3.30 − €3.00) ÷ €3.00. But the total rose €3.60 because you also bought an extra pack. At September’s price, two packs would have cost €6.00; the price increase accounts for the remaining €0.60.
That distinction is why the items matter. A transaction total alone cannot tell you whether a higher grocery bill came from prices, quantities or a different basket.
Check that the comparison is fair
- Match the product and pack size. Ten eggs and six eggs are different purchases, even if their names look alike.
- Check quantities, weights, discounts and receipt-reading mistakes before comparing amounts. For different pack sizes, calculate a price per unit or kilogram.
- Use the same store when asking how a price changed over time. Use comparable products and dates when comparing stores.
- Treat an old receipt as evidence of a past purchase. It cannot confirm today’s shelf price or a store you have not recorded.
Reign’s price history depends on the receipts you record and the items it can match. Missing receipts leave gaps. A temporary offer or a change of product can look like a price change, so open the underlying purchase before drawing a conclusion.
Set a target if you want one
Choose a category you want to follow and set a monthly spending target. As you record purchases, you can compare the category’s spending with that amount.
If the total is different from what you expected, open the underlying transactions. A restock, a party or a price rise can each move the number.
Start with your next grocery receipt. A few weeks of recorded purchases will give you more to compare than a single shopping trip.
Related reading: categorizing mixed purchases and how receipt scanning works.